Since the launch of Performance Max campaigns, Google has been literally bending over backward to attract as many business users as possible by making Google Ads an accessible tool, even for beginners. However, when it comes to reporting in your Performance Max campaign, this is where Google falls short. The reporting section in Google Ads API is a nightmare to use for inexperienced users, but we come to the rescue.
- What is Google Performance Max Reporting?
- Why Performance Max Reporting Matters
- Asset Group Reporting
- Combinations Report
- Placement Report
- Landing Page Report
- Budget and Bidding Strategy Report
- Traffic by Device Reporting
- Reporting Script
- Google Analytics Reporting vs Google Ads Reporting
- Limitations to Performance Max Reporting
- Conclusion
What is Google Performance Max Reporting?
Google Performance Max Reporting refers to the analytical tools provided by Google to track and assess the effectiveness of Performance Max campaigns. Performance Max campaigns are a type of advertising initiative that utilizes Google’s machine learning algorithms to optimize bidding, targeting, and ad placement across various Google properties, including Search, Display, and YouTube. Here, you can find in detail what is Google Performance Max.
The reporting features within Performance Max allow advertisers to gain insights into key metrics such as clicks, impressions, conversions, and return on investment (ROI). With detailed reporting capabilities, advertisers can analyze their campaigns’ performance, identify improvement areas, and make data-driven decisions to maximize their advertising outcomes.
We’ll cover the most important reporting categories:
- Asset Group
- Combinations
- Placement
- Landing Page
- Budget and Bidding Strategy
- Traffic by Device
- Reporting Script (BONUS)
Why Performance Max Reporting Matters
Performance Max is a game-changer for those who can use it efficiently. Letting Google handle the heavy lifting with PMax campaign automation can definitely be a winner. But here’s the thing – reporting still plays a crucial role.
- Optimization. How to optimize Performance Max campaign? Solid reporting means you’re armed with insights into your campaigns’ performance. With this info, you can fine-tune your strategy for even better results. Sure, PMax campaigns are automated, but the more you understand what’s happening under the hood, the quicker you can steer things in the right direction and boost those returns.
- Communication. Your reports need to be crystal clear for everyone involved. When stakeholders can easily grasp the impact of your PMax campaigns, it makes life smoother for you as a PPC manager. Plus, it sets the stage for smart decisions on budget and resources, ensuring your Google Ads account shines bright in the future.
Check these Google PMax examples to understand how it works IRL.
Asset Group Reporting
Asset Groups offer a fantastic opportunity to tailor your messaging precisely for your target audiences. A recent update in Performance Max introduces reporting on the overall asset group performance. It brings two new reports for asset groups. One report covers the resources used to create ads within your asset groups. Essentially, the creatives within your asset group are utilized to craft ads across various ad formats, reminiscent of Responsive Search Ads combined with Responsive Display Ads, which are familiar to seasoned Google advertisers. The second report provides top-level performance metrics for each of your asset groups.
How to use it:
- From the section menu, select Campaigns.
- Choose your desired Performance Max campaign from the list.
- From the overview page, click on Asset Groups from the left side of the page menu.
- Choose your desired asset group and click on View Details.
In asset group reporting, you’ll find critical performance metrics like impressions, clicks, conversions, and conversion rates for each asset group. This data lets you discern which assets are most effective and resonate with your target audience.
The default metrics include:
- Conversions: This metric counts instances where individuals engage with your ad or free product listing and perform an action considered valuable to your business. Monitoring conversions provides insights into customer engagement with ads featuring assets from your Performance Max asset group.
- Conversion value: By tracking conversion value alongside your conversion goals, you can accurately evaluate and optimize the genuine impact of your ad campaigns. This fosters data-driven decision-making and more effective resource allocation.
- Conversion rate: This metric offers insights into ad effectiveness by indicating the average number of conversions per ad interaction, expressed as a percentage. Regular monitoring ensures continued visibility for top-performing assets within your asset group.
- Cost per Conversion: This metric reveals the average cost per conversion, calculated by dividing total costs by the number of conversions recorded. Evaluating this figure aids in ensuring that investments yield favorable outcomes and prompts optimization of the asset group.
Armed with this data, you can make informed decisions to refine your campaigns. For instance, identifying consistently high-performing asset groups may warrant increased budget allocation or resource allocation. On the other hand, underperforming asset groups may prompt strategic adjustments to enhance performance or replacement with new assets.
Asset Detail Report
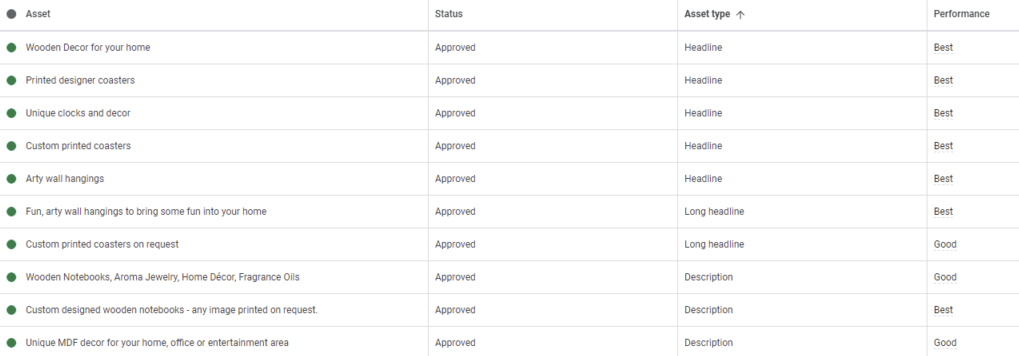
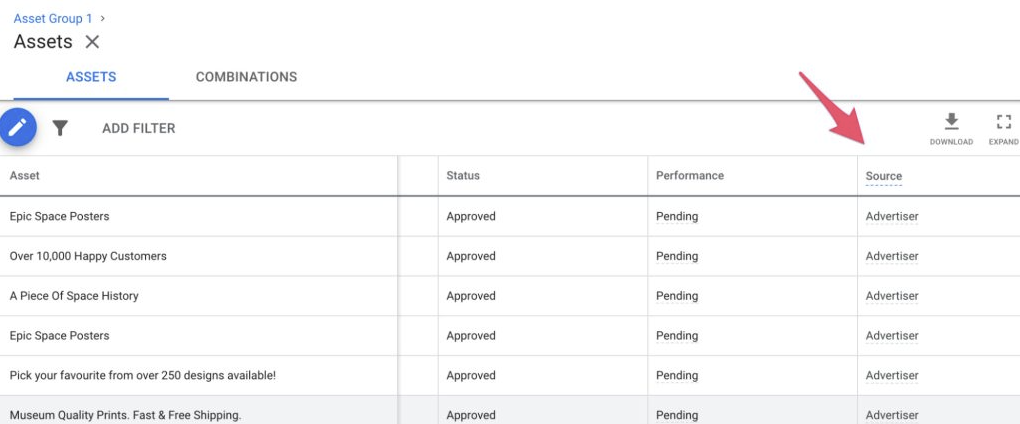
The Asset Detail functions as a kind of asset report, giving you all the details you need to customize your message for your audiences, check out how each asset is performing, and spot any potential issues. To access this report, head to the asset groups in one of your Performance Max campaigns and hit the ‘View Details’ link for the asset group you want to dig into.
Once you’re in, you’ll find a table listing all your assets within that group. In the asset column, you’ll see the content of each asset, while the asset type column specifies whether it’s a headline, description, or image. The performance column ranks assets performance as low, good, or best. Any assets labeled “pending” simply haven’t gathered enough data for Google to evaluate yet.
Combinations Report
The Combinations report for your Performance Max campaigns serves as an indispensable tool, aiding in the identification of optimal asset combinations within each asset group. Moreover, it facilitates a visual representation of your creatives within ads by highlighting a selection of top-performing asset combinations from each asset group.
By categorizing asset combinations into text, images, and videos and presenting the six best combinations in each category, this report streamlines the process of identifying and prioritizing top-performing ads. Additionally, it offers the opportunity to preview the appearance of asset combinations across various networks, including Search, Display, YouTube, and Gmail.
How to use it:
- Select the Campaigns option.
- Choose the Performance Max campaign you want to view on the Campaigns page.
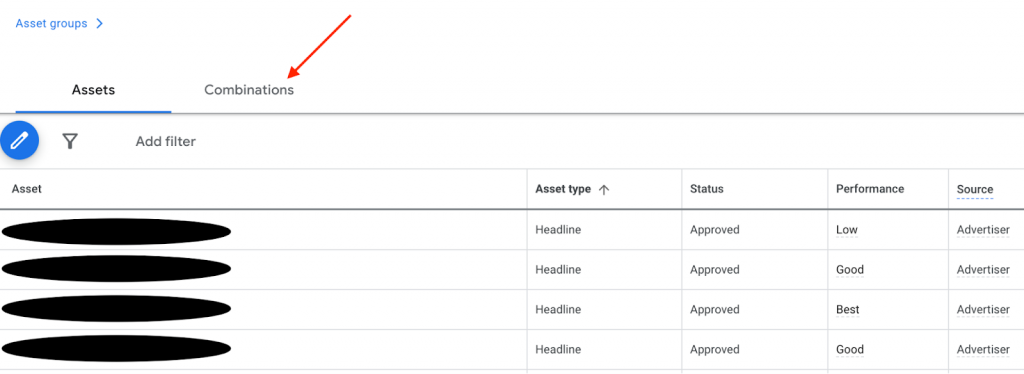
- Click on the Asset Groups tab, then View Details.
- On the Asset report page, click on the Combinations tab.
- Each title displays the top 6 combinations for text, image, and video assets, ranked by performance.
- Click the Preview Ads button on the tiles to preview your asset combinations.
Placement Report
The Placement Reporting feature in Performance Max campaigns gives you insights into where your ads appeared and how many times they were seen on placements beyond the Google search engine. While the data available may be limited for now, it still provides valuable information that can assist you in making informed decisions to either expand or enhance your campaigns.
Although it can be a bit tricky to locate Performance Max placement reports, you can simplify the process by utilizing a custom report in Google Ads to extract data on Performance Max placements. While the information in the destinations report may not encompass results from all channels, it does provide valuable insights into the origins of your traffic.
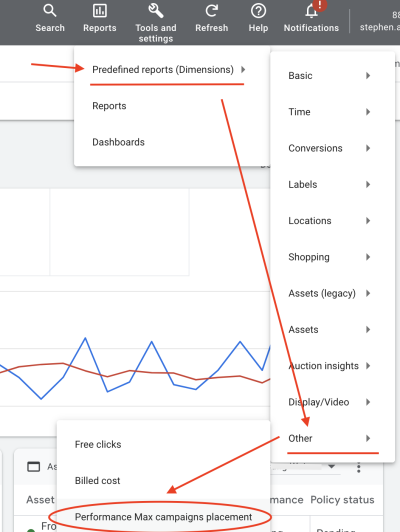
To find your Placement Report, Go to Reports > Predefines reports (Dimensions’) > Other > Performance Max campaigns placement.
The Placement Report typically comprises two main categories:
- Google Owned & Operated: This category contains all sites owned and operated by Google, including popular platforms like YouTube, Gmail, Play, and Discover. The placement report consolidates impressions served on Google-owned properties under this category.
- Anonymous Google placement: This refers to ad placements where publishers opt to maintain confidentiality regarding their site names from advertisers.
It’s important to note that the search channel is not included in placement reporting since it is not classified as a placement.
Landing Page Report
When Performance Max was initially rolled out, reporting on landing pages could only be done through Google Analytics. Currently, there isn’t a specific landing page report available in any campaign, but there’s a workaround to create a custom report within the Google Ads reports section.
Here’s how you can set it up:
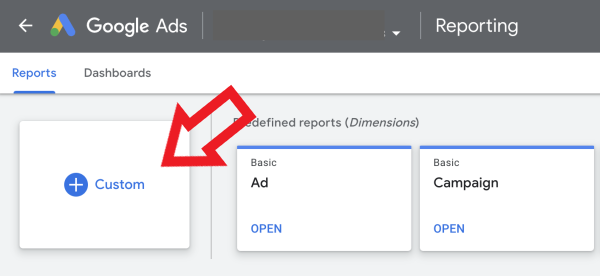
- Head to the reports section in Google Ads and start creating a custom report.
- Include two row headings: Campaign and Landing Page.
- Add column metrics such as clicks, impressions, CTR, conversion rate, and revenue.
- Use the Filter option at the upper right corner to focus the report on landing page data for specific Performance Max Campaign(s).
- Select your desired Performance Max campaign and hit Apply.
- The resulting display will showcase metrics for each landing page associated with the chosen campaign.
It’s important to note that these metrics encompass all ad formats, leading to varying performance based on the landing page Performance Max utilizes for each ad.
If you come across problematic pages, excluding them as landing pages from Performance Max can enhance performance. This data can also help you add pages to the landing page exclusions within your Performance Max campaign settings.
Budget and Bidding Strategy Report
Managing your Performance Max campaigns can be quite the challenge, especially when you’re thinking about tweaking your bidding strategies and budgets without having impression share metrics at your disposal. But fear not, we’re here to lend a hand!
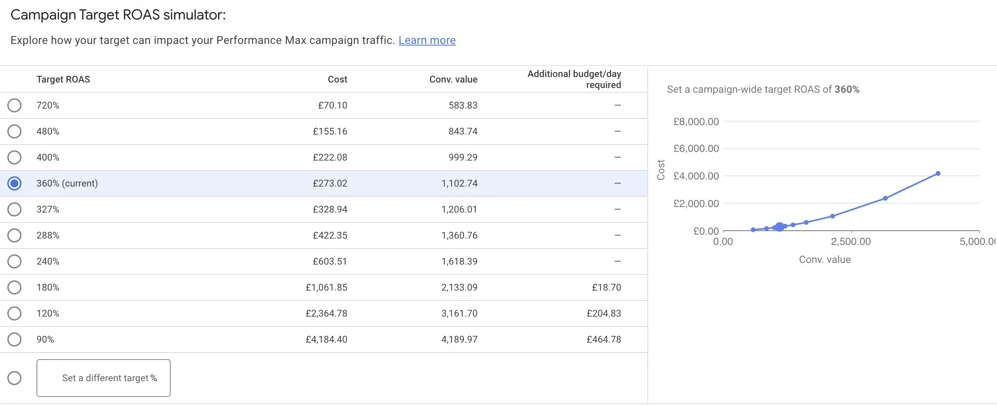
Let’s get one thing straight – this isn’t exactly a results report, but it does offer a way to approach adjusting your bidding strategies and budgets. The ‘Bid & Budget Report,’ which you can find at the campaign level, is a handy tool for identifying potential adjustments and estimating their impact using the “Campaign Target Simulator.”
It’s crucial to stay alert about budget constraints, especially after launching new campaigns, to ensure you’re not missing out on potential conversions. To access the Campaign Target Simulator, simply hover over the icon under the budget column while viewing the list of your campaigns in your Google Ads interface. Depending on your bid strategy, this simulation feature can combine potential targets with your budget to give you an idea of the likely effects of any proposed adjustments.
When considering adjusting your ROAS target, it’s crucial to grasp the potential impact. Raising your ROAS target might lead to fewer clicks, subsequently resulting in reduced conversions and revenue. On the other hand, if you loosen your bid strategy constraints by lowering your ROAS target, you may notice a boost in traffic and conversions, albeit at a higher cost.
Traffic by Device Reporting
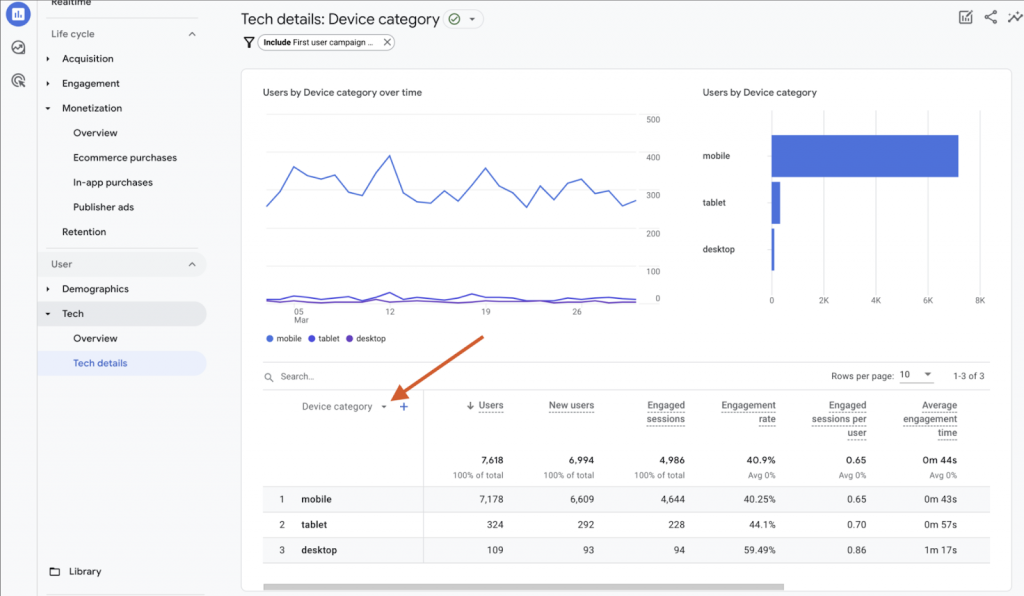
In Google Performance Max campaigns, the absence of a feature to view performance by device type forces the use of Google Analytics 4. Fortunately, accessing this data is straightforward, thanks to the standard ‘Tech Details’ report available under the ‘Tech’ section in the main reports menu.
To begin, ensure you have ‘Device Category’ selected in the leftmost column of the table view. This setting is crucial for the analysis you’re seeking. By default, the data encompasses all traffic sources, so applying a filter is necessary to isolate device-specific data relevant to your Performance Max campaign(s).
Implementing a filter for ‘First User Campaign’ and specifying the relevant Performance Max Campaign(s) from the drop-down menu will provide insights into traffic by device.
You might wonder why the First User Campaign is chosen over Session Campaign. The explanation lies in how conversions are attributed to the data. ‘First User Campaign’ adopts a first-click attribution model, offering insight into the initial touchpoints leading to conversions. Alternatively, Session Campaign portrays the last-click touchpoints preceding the final sale.
Now, you may question the utility of examining traffic by device when device bid adjustments are absent in Performance Max, and the bidding strategy ostensibly manages everything. While it’s true that the bidding strategy handles most aspects, analyzing traffic patterns by device can be invaluable, particularly when diagnosing periods of poor sales performance. Even if traffic appears normal with no asset issues or significant alterations, fluctuations in traffic patterns across device types could explain unexpected sales downturns.
Reporting Script
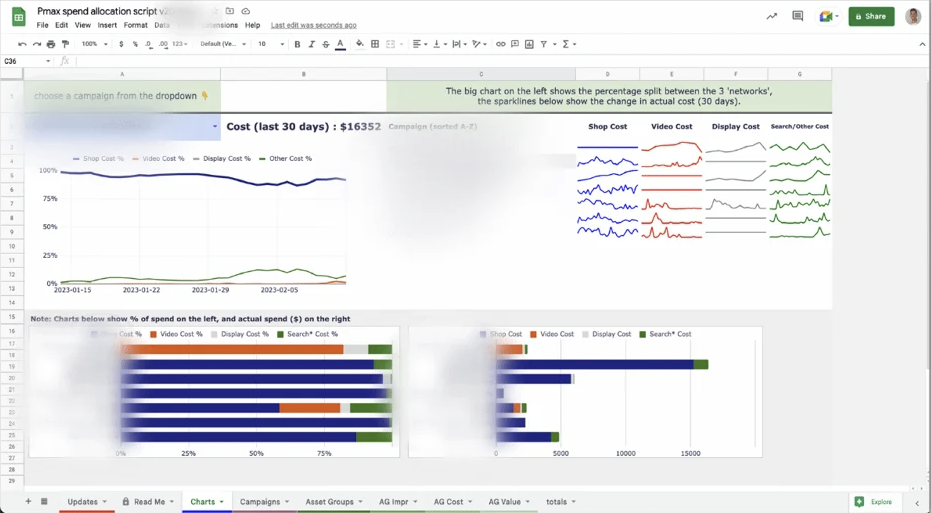
Have you thought about incorporating a reporting script into your Performance Max campaign? AgencySavvy has a brilliant data expert who developed a script that offers a detailed breakdown of performance across Search, Display, Shopping, and Video channels.
While it’s a bit more advanced, implementing this script could be well worth the effort. It’ll give you a clear picture of how your Performance Max budget is being allocated and the outcomes across various channels.
Once integrated, this script will populate a spreadsheet with data from the past 30 days, offering you plenty of insights to analyze and delve into.
Google Analytics Reporting vs Google Ads Reporting
Performance Max campaigns can significantly increase when you integrate them with Google Analytics. It’s like unlocking a treasure trove of insights into user behavior, demographics, and conversions. Google Analytics gives you this bird’s eye view of your website traffic from all angles, but when it comes to reporting for PMax, things have gotten seriously slick in recent years.
Now, when you use Google Ads reporting for Performance Max campaigns, it covers every touchpoint users have with your ads. We’re talking channels, devices, search terms – the whole package. It paints this vivid picture of how users engage with your ads and where they finally convert. But here’s the thing: Google Analytics tends to focus more on that last-click attribution, which can miss out on the bigger picture.
We strongly encourage you to stick with Google Ads reporting for your PMax campaigns and keep Google Analytics in the loop. Having both on board makes measuring and optimizing a powerhouse.
Limitations to Performance Max Reporting
The primary challenge with PMax campaign reporting lies in the difficulty advertisers face in obtaining a comprehensive overview of their performance compared to the transparent and hands-on functionality of traditional Google Ads campaigns.
Here are some limitations that hinder effective PMax campaign reporting:
Limited Granularity of Performance Max Data
PMax campaigns offer fewer reporting options compared to other Google Ads campaigns. The absence of ad groups and keywords complicates data segmentation, hindering thorough performance analysis.
Lack of Detailed Data on Audience Behavior, Ad Placement Control, and Budget Allocation
Advertisers have minimal control over ad spend allocation and limited insights into audience behavior and ad placement within Performance Max campaigns.
Challenges with Google Analytics Navigation
Analyzing website data from Performance Max campaigns requires navigating through a separate grouping labeled “Cross Channel,” which may not align with default channel groupings. Dimension filters incompatible with PMax campaigns can further complicate data interpretation in Google Analytics.
Ineffectiveness of Traditional Analysis Tactics
Traditional analysis methods may not be suitable for PMax campaigns due to real-time optimization and limited control over variables like ad placements and creative elements. Customizing reports, conducting A/B tests, and implementing granular audience targeting are restricted, impacting campaign optimization efforts.
Difficulties in Cross-Channel Reporting
Understanding the performance of Performance Max campaigns across various Google channels is challenging. Knowing the best and worst-performing channels and spending allocation is crucial but hard to obtain. Additionally, understanding how these channels interact with each other and with other online channels poses a significant challenge.
Understanding these limitations is essential for devising effective solutions and workarounds to optimize Performance Max campaign reporting.
Conclusion
Understanding the intricacies of Performance Max reporting is crucial to monitor your progress. Wrapping up, it’s crystal clear that performance reporting is an absolute game-changer for any organization serious about staying relevant in business. It’s like having a trusted advisor whispering insights into your ear, helping you make savvy decisions, and constantly pushing for improvement. Hence, that’s why Google did Smart Shopping upgrade to Performance Max, ditching its predecessor entirely.
With performance reporting, you’re not just guessing or flying blind. You’ve got a roadmap right in front of you, guiding you toward your goals with precision. And in today’s fast-paced business world, where every decision counts, having that kind of clarity and direction is pure gold.

A dedicated copywriter with over 3 years of experience behind him. He loves writing about SEO, video games, and the ever-evolving world of NFTs. Passionate about content that performs (and preferably ranks on page one), while habitually overthinking meta descriptions. When he’s not at the keyboard, you’ll find him deep in a story-driven game or somewhere lost (on purpose) in the mountains—preferably without cell signal.